The
BioGraph Infiniti DynaMap Suite, combined with any of four Thought
Technology encoders; FlexComp Infiniti, ProComp Infiniti, ProComp+,
or ProComp2, lets you record, replay and review 2-10 channel SEMG
monitoring and biofeedback sessions. Over 100 screens display SEMG
readings combined with other physiological signals. A key feature is
live video, which enhances the review of data enabling one to view
the video display while pinpointing a moment in time for statistics
for each measure. Dual monitor screens also play a key role in the
software, allowing the client to view what is required for feedback
and the clinician to view the actual data. The BioGraph Infiniti
software also lets you edit the existing screens and create new ones
of your own.
DynaMap for the FlexComp Infiniti
provides 7 channel sets and 57 screens for high resolution and
accurate multi-channel SEMG data-acquisition.
The 7
channel sets allows you several choices: connect up to 10
MyoScan-Flex sensors for raw SEMG recording, a combination of 6
MyoScan-Flex Sensors and 4 Goniometers, 6 MyoScan and 2 Goniometers,
6 MyoScan with 2 Force Sensors, 10 Force Sensors, 10 Goniometers, 2
MyoScan-Flex with EKG, Temperature and Skin Conductance for SEMG and
peripheral biofeedback. On-board Compact Flash memory gives you the
capability to save data directly to the encoder for real life
assessments away from the office or lab.
 |
Left is a two channel recording screen, for observing the
interplay of median frequency and RMS data between two bilateral
sites. All median frequency (MF) statistics are based on
smoothed MF to provide a smoothed view of this measure.
|
DynaMap for the ProComp Infiniti includes 7 channel sets and
48 screens for multi-channel raw and RMS SEMG combined with up to 6
other physiological measures.
Screens include exciting new 3-D graphics of animated figures that
work with the client. As the client moves the animation moves! In
addition there are screens to look at the interplay of median
frequency and RMS data between bilateral sites. The raw EMG signals
can be displayed raw or, as RMS in line graphs and bar graphs as
well as 2-D and 3-D spectral displays synchronized with video.
This screen shows two channels of RMS data derived from channels
A and B raw inputs to the ProComp Infiniti shown in a multi line
graph and 3D power spectrum displays.
DynaMap for the ProComp+ encoder
includes 7 channel sets and 37 screens for 8-channels of SEMG or a
mix of 2 channels of SEMG with up to 6 other physiological measures.
Build your own screens using one of our comprehensive channel sets,
which includes physical and virtual (including statistics) channels
or use the Developer Tools to make changes to the existing channel
set to meet your needs. Each of the 7 different channel sets allows
for a different use of the ProComp+.
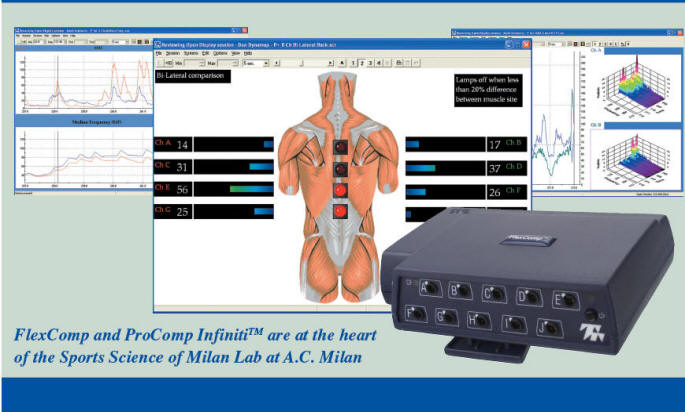
This screen is for bilateral comparison of para-spinal muscle
activity, divided into four pairs of SEMG sensors at C7–T1, T6–T7,
T12–L1 and L2–L3. When the difference in SEMG between any pair is
greater than 20% a light turns red. Animated bars and digital
displays show RMS SEMG of each muscle.
DynaMap for the ProComp2 includes 4 channel sets and 15
screens for 1 and 2-channel SEMG applications. It allows you to
select from four different sensor combinations for the ProComp2 to
use SEMG or either a force sensor, goniometer or torsiometer.
For example, choose a channel set for 2 MyoScan-Pro sensors for SEMG
and load a screen to display RMS muscle activity at muscle pairs
during movement. A difference greater than 20% between muscle pairs
is indicated by the light turning red. Video enables viewing of the
motion performed at the same time!
Here are some more samples of SEMG screens:
- 10
channels of RAW EMG each on its own line graph:
- A
sample of information from the output of channel A. Raw Line
graph, RMS line Graph, Max, Mean, Min, Std Deviation, Variability
stats, and Median and Peak Frequencies and a 2D power spectrum:
- 10
channels of Spectral from Raw EMG divided bilaterally two signals
left and right per spectral display with RMS EMG bargraphs for
each channel at the side:
- 10
channels of RMS data derived from the 10 RAW inputs to the
FlexComp shown in multiple bar graphs with digital display of
value:
- 10
channel review screen, with instruction. RMS data shown.
-
2 channel recording screen, for looking at interplay of median
frequency and RMS data between two bilateral sites. Median
Frequency data shown.
-
Bilateral comparison of para-spinal muscle activity, or
para-spinal and cervical comparison. Bi-lateral difference when
greater than 20% is indicated by lights turning red. Designed with
the intent of evaluating para-spinal muscle pairs during forward
flexion. Layout of the screen such as to aid in the bilateral
evaluation of problem areas.
|